Resolving chart display issues
There is a known issue that prevents displaying charts when browser zoom level is not 100% on certain web browsers, operating systems, and device/screen manufacturers with different pixel densities.
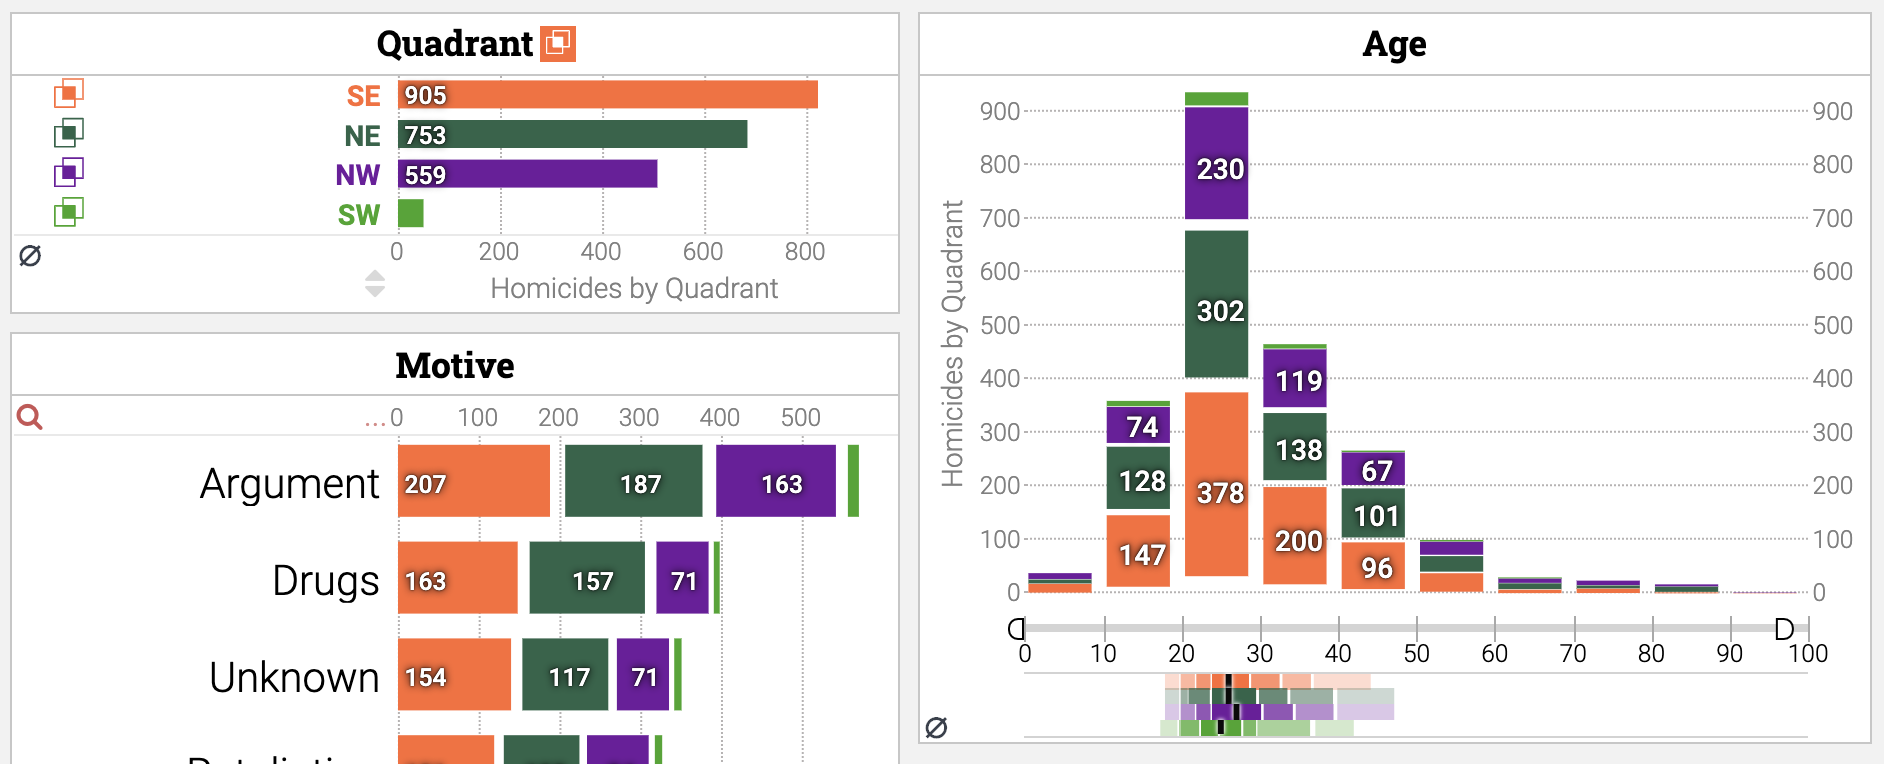
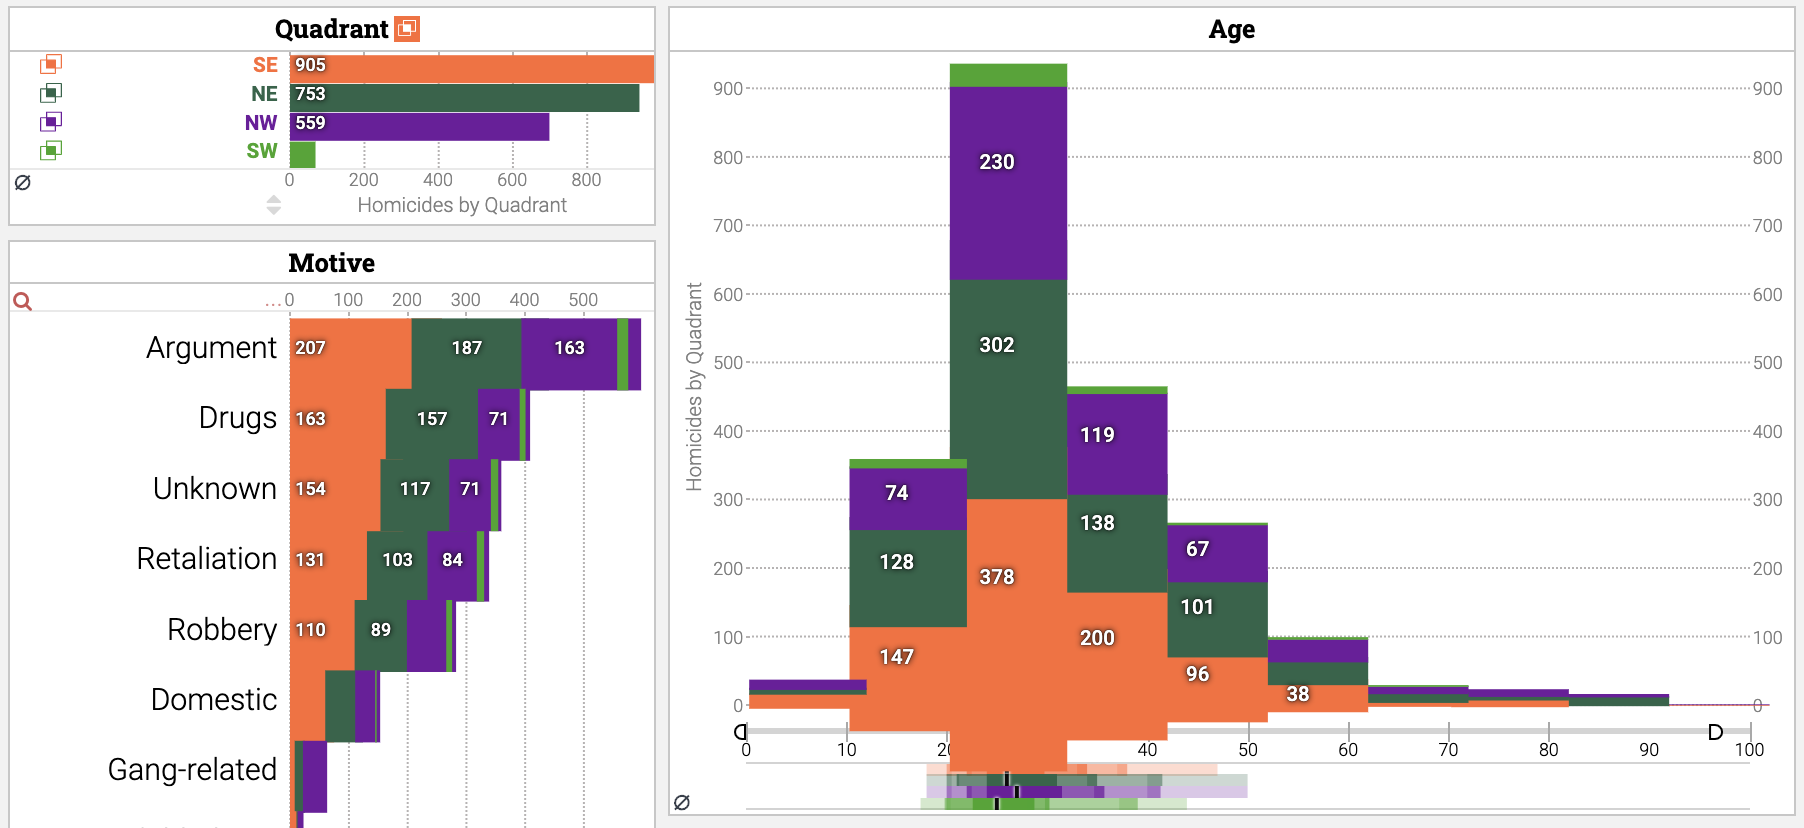
Below are two examples, captured on a Chrome browser version 80 running on a MacBook Pro retina display with the MacOS Mojave 10.14. Zoom levels are set 110% for top image, and 80% for bottom image. If you observe similar unwanted artifacts, please refer to the potential resolutions noted below.


Resolving the Issue
Keshif aims to automatically detect when browser zoom level is not 100%, and warns you if the current settings may affect the quality of charts. Our automated fix is available with this warning window, and it resolves many of the cases we detected on our tests.

When you apply the fix, Keshif adjusts its own dashboard zoom level and reloads the page.
The setting is saved on your browser, so that when you load the dashboards in the future, it's automatically adjusted again without prompts.
Note: Due to the inconsistencies across different browsers, operating systems and device settings, Keshif may not be able to auto-detect, or auto-fix all potential situations. The differences in these settings prevents a standard solution that works across all cases.
If the adjustment does not resolve your issue, you can remove it by clicking the "reset zoom level" icon on the corner of the dashboard. This icon is displayed only when the zoom level adjustment is active.

Instructions for manually changing zoom levels on your browser
- Google Chrome - Change text, image, and video sizes (zoom)
- Safari - Change the font size or zoom level of web pages in Safari
- Firefox - Font size and zoom - increase the size of web
pages -
Note: We have not experienced zooming-related issues on Firefox version 74
If you continue experiencing issues, please let us know. Please include the browser you are using, with version, operating system, and your device information.
