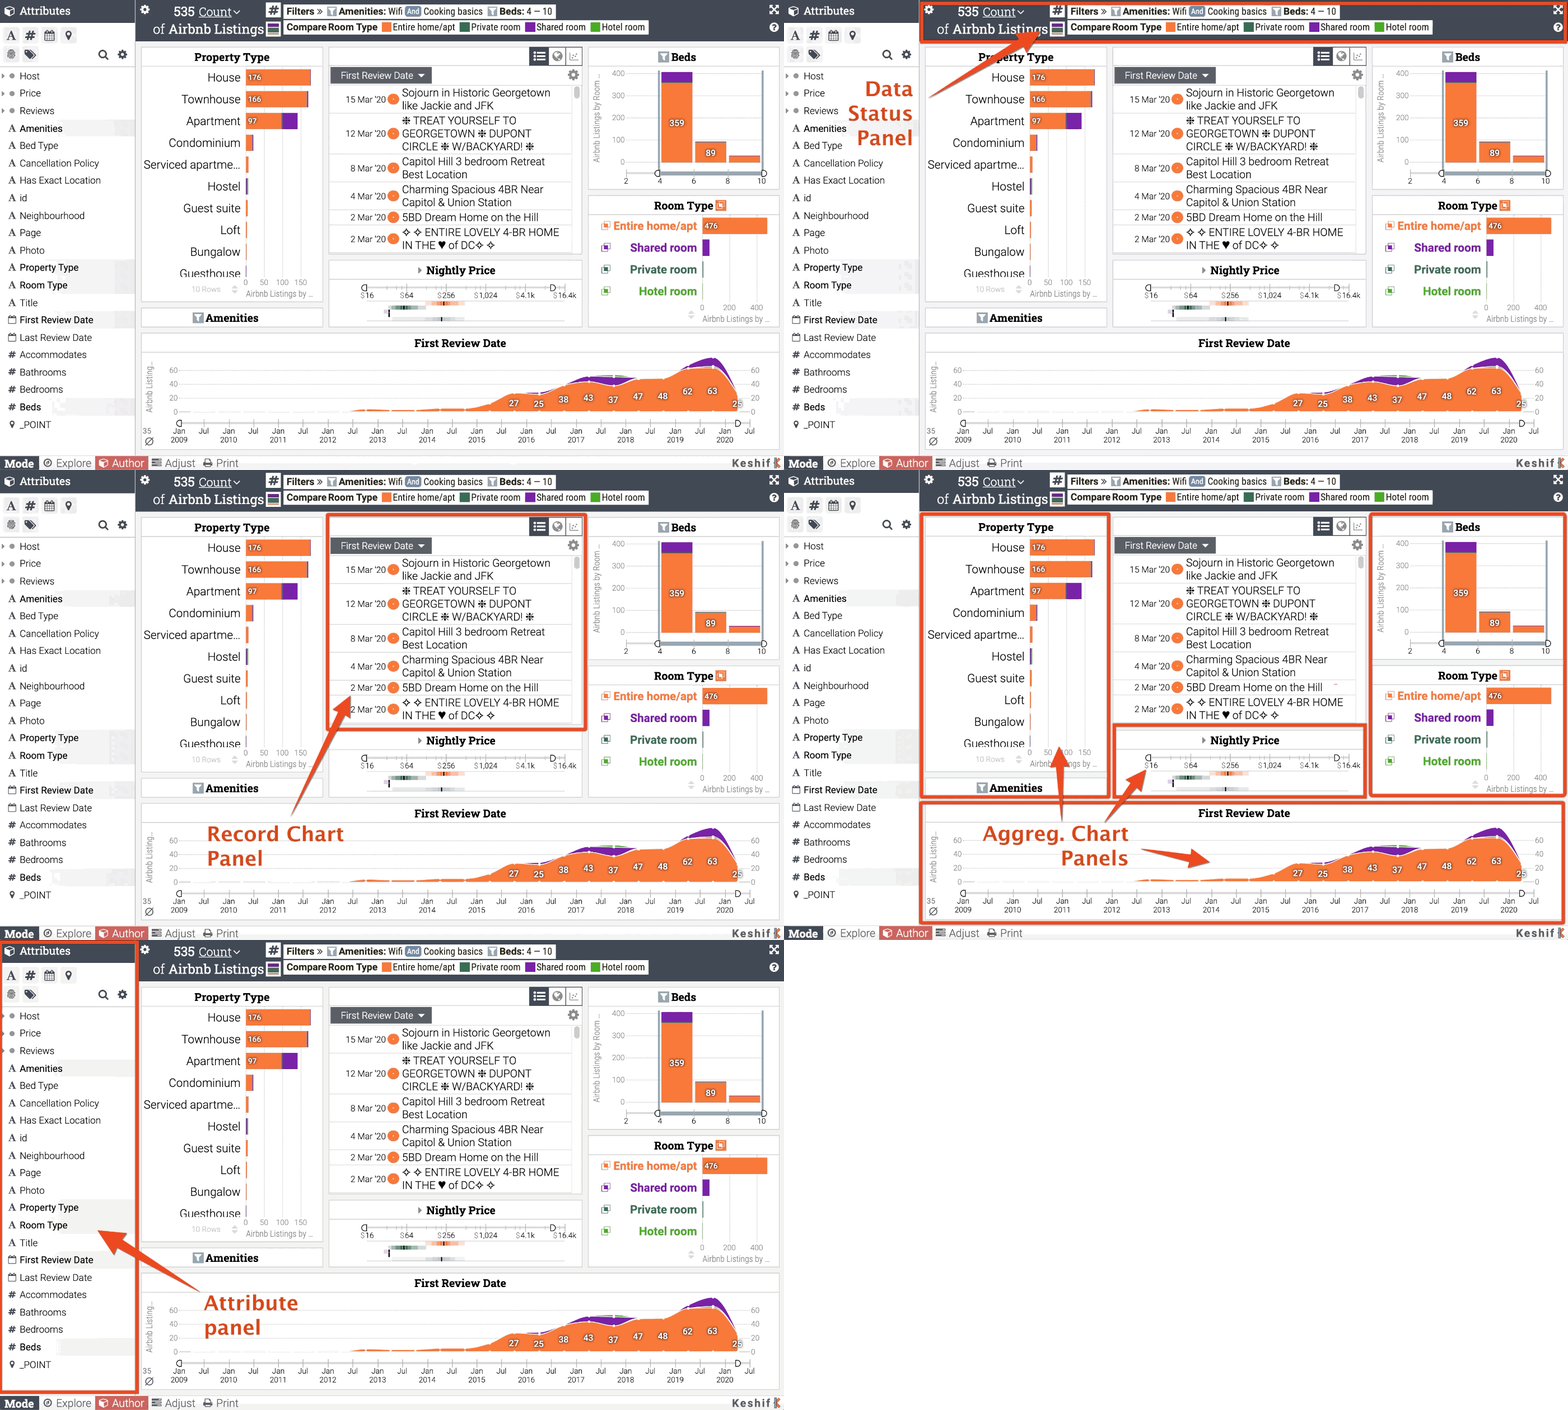
◆ Overview of dashboard layout
A Keshif dashboard includes
- A data status panel,
- Up to four panels that can contain various aggregated charts,
- A record chart panel that shows the individual records (rows) of the dataset, and
- An attribute panel to see all features of the dataset to build a dashboard.

Using data status panel
The data status panel allows easy and accurate interpretation of visual analytics across the full dashboard. It can always be found at the top of the dashboard.
Overview of common chart controls
The charts are the primary data visualization elements in a Keshif dashboard. While the chart types differ based on visualized data type and analytical settings, they share a set of design element and controls.
Record chart panel
The record charts itemize each record (row) in a dataset individually, and visualize the data as a list, map, scatter plot, or time-series chart. The record chart is positioned on the middle section of the dashboard.
Aggregate chart panels
Aggregate chart panels can include multiple charts, stacked vertically. The four aggregate chart panels are positioned on the left, right, and below the record chart, including the bottom chart area spanning the full width of the dashboard.
-
Adding aggregated charts into dashboard
-
Removing charts from dashboard
-
Moving aggregated chart positions in dashboard
Attribute panel
The attribute panel includes an organized list of all data attributes, also called variables, columns, or features, in a dataset. It appears on the left-most side of the dashboard, and is available in Author dashboard mode only.
Using the record details window
The record details window shows the details of a selected record. It's positioned in the middle of the dashboard, on top of the dashboard, to enhance the focus on the record.
Adjusting dashboard layout
You can close a chart in a dashboard to create more space, or to open it show more data across more charts. You can also adjust the panel (chart) widths.
Changing dashboard mode
Select the appropriate dashboard mode for your main purpose – Explore, Author, Adjust, and Capture.
Special Features
- The dashboard layout is dynamically adjusted based on the width of the browser window.
- The middle panel, including record chart panel, uses the remaining dashboard width based on the width of left and right panels combined. While this increases responsiveness of the design, you cannot control the width size of the record chart panel for all display configurations.
- The height of the charts are dynamically calculated. The charts are presented in a
stacked way within each panel to accommodate as many charts as possible.
- If the panel height is not tall enough to show all charts within, some charts may be forced-closed by the Keshif layout engine.
